Trading Indicator Highlight: Fibonacci Retracement
Fibonacci lines are levels of potential interest on a chart, marked by horizontal lines calculated from points of previous price action. The lines can be used to find likely areas of support following a pullback (Fibonacci retracements) or potential resistance in an uptrend (Fibonacci extensions).
Fibonacci numbers
These levels are based on Fibonacci numbers, which are used in calculating the Golden Ratio (1.618:1) - a proportion often found throughout the universe, in everything from the spirals of seeds in a sunflower to the structure of the human face. The famous Fibonacci sequence is created by taking two numbers (typically 0 and 1) and calculating the next number by adding the previous two:
0, 1, 1, 2, 3, 5, 8, 13, 21, 34, 55, 89, 144, 233...
As the sequence progresses, the ratio between two consecutive numbers tends towards 1.618. For example, 233/144 = 1.61806.
The ratio is used to calculate several numbers that can give areas of interest for the depth of a retracement: 23.6%, 38.2%, 50% (not a Fibonacci number but typically included), 61.8%, and 78.6%.
Any two price points of interest on the chart are selected, typically a high and low, and the indicator is then used to draw lines at these percentages.
Examples
Bitcoin found a local bottom at $28,800 on 22 January, 2021. It then rallied to $58,354 on 21 February, 2021, before retracing. The total move from low to high was $29,554. Areas of interest as potential support according to Fibonacci retracements therefore include:
- $51,379 (23.6% retracement)
- $47,064 (38.2%)
- $43,577 (50%)
- $40,090 (61.8%)
- $35,125 (78.6%)
- $28,800 (100% or full retracement)
How Fibonacci levels can be used in trading
Fibonacci levels can be useful when trying to determine areas of possible support and resistance, but should always be used in conjunction with other indicators when possible.
In the example above, $40,090 broadly coincides with earlier resistance at the prior local top on 8 January, strengthening this as a potential support zone. This also broadly coincided with the 50-day moving average, meaning that this could be a good zone to close a short, take a long position, or set a stop-loss.
It’s important to recognize that Fibonacci levels are not definitive – like other indicators, they represent potential areas of interest and points of more favourable risk/return. Since there are several levels, it can be hard to choose the right one. The 0.618 (61.8%) level is often seen as particularly significant.
Fibonacci levels are fixed lines, based on past events, and do not change like moving averages. Therefore confluence with other indicators (like MAs) will change over time.
Fibonacci Retracements vs Fibonacci Extensions
While retracements are useful for finding support in pullbacks, Fibonacci extensions are useful in uptrends. They can also be useful in periods of price discovery, where Bitcoin (for example) makes a new local or macro high and there is limited data from other indicators.
How to add the Fibonacci numbers to a Chart
Open your desired market on TimeX.io exchange, i.e the TIME/BTC market, locate the price chart window, and click next to the fork symbol on the left to show the additional tools in the list.
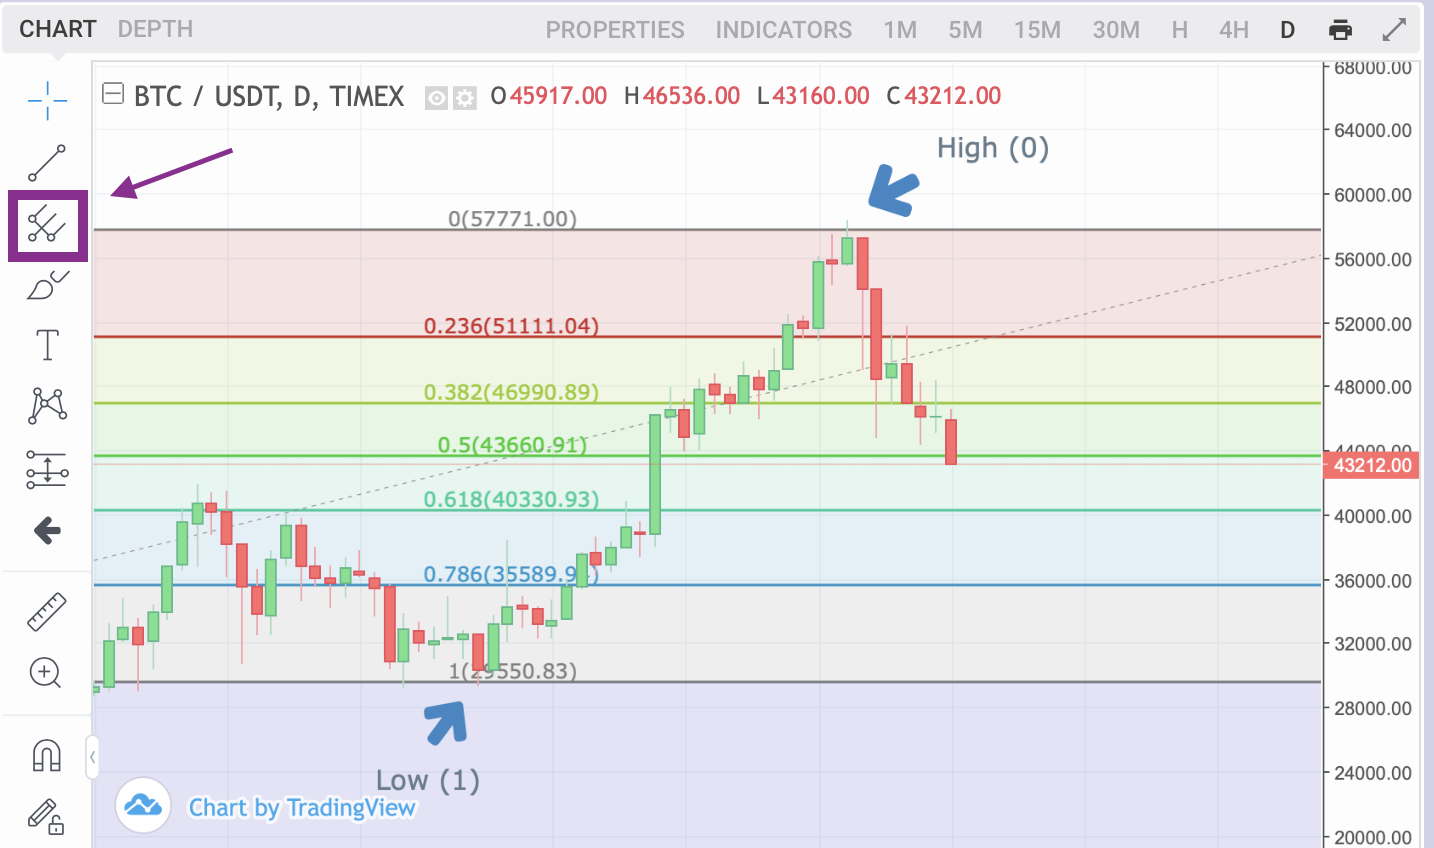
From there, select Fib Retracement, go over to the chart and set the two points defining the range you want to show the Fibonacci levels of.